Quantyl Discovery


Visualize, explore and analyze large datasets like never before

a Microsoft certified application

Fast

More data - Faster results - Faster decisions

Effortless interaction with millions of rows
Use the full potential of your machine
Highly optimized for multicore
Native 64-bit app

Selection Power

See everything - Miss no details

Both aggregated and non-aggregated data - Not BI focused
Select, search, filter or even animate anyway you want to
Perform selections in the most complex contexts
Realtime selection brushing or filtering
Python and R friendly

Private

Your data remains in house and confidential

All-in-one application, no data upload
No data lock-in with a cloud subscription
Free viewing

Designed from the ground up for maximum performances and interactivity on modern PC (Windows 11 & 10).

Quantyl Discovery user interface

What Quantyl Discovery does

A unique data experience

Selection is the most important function to interact with any data.


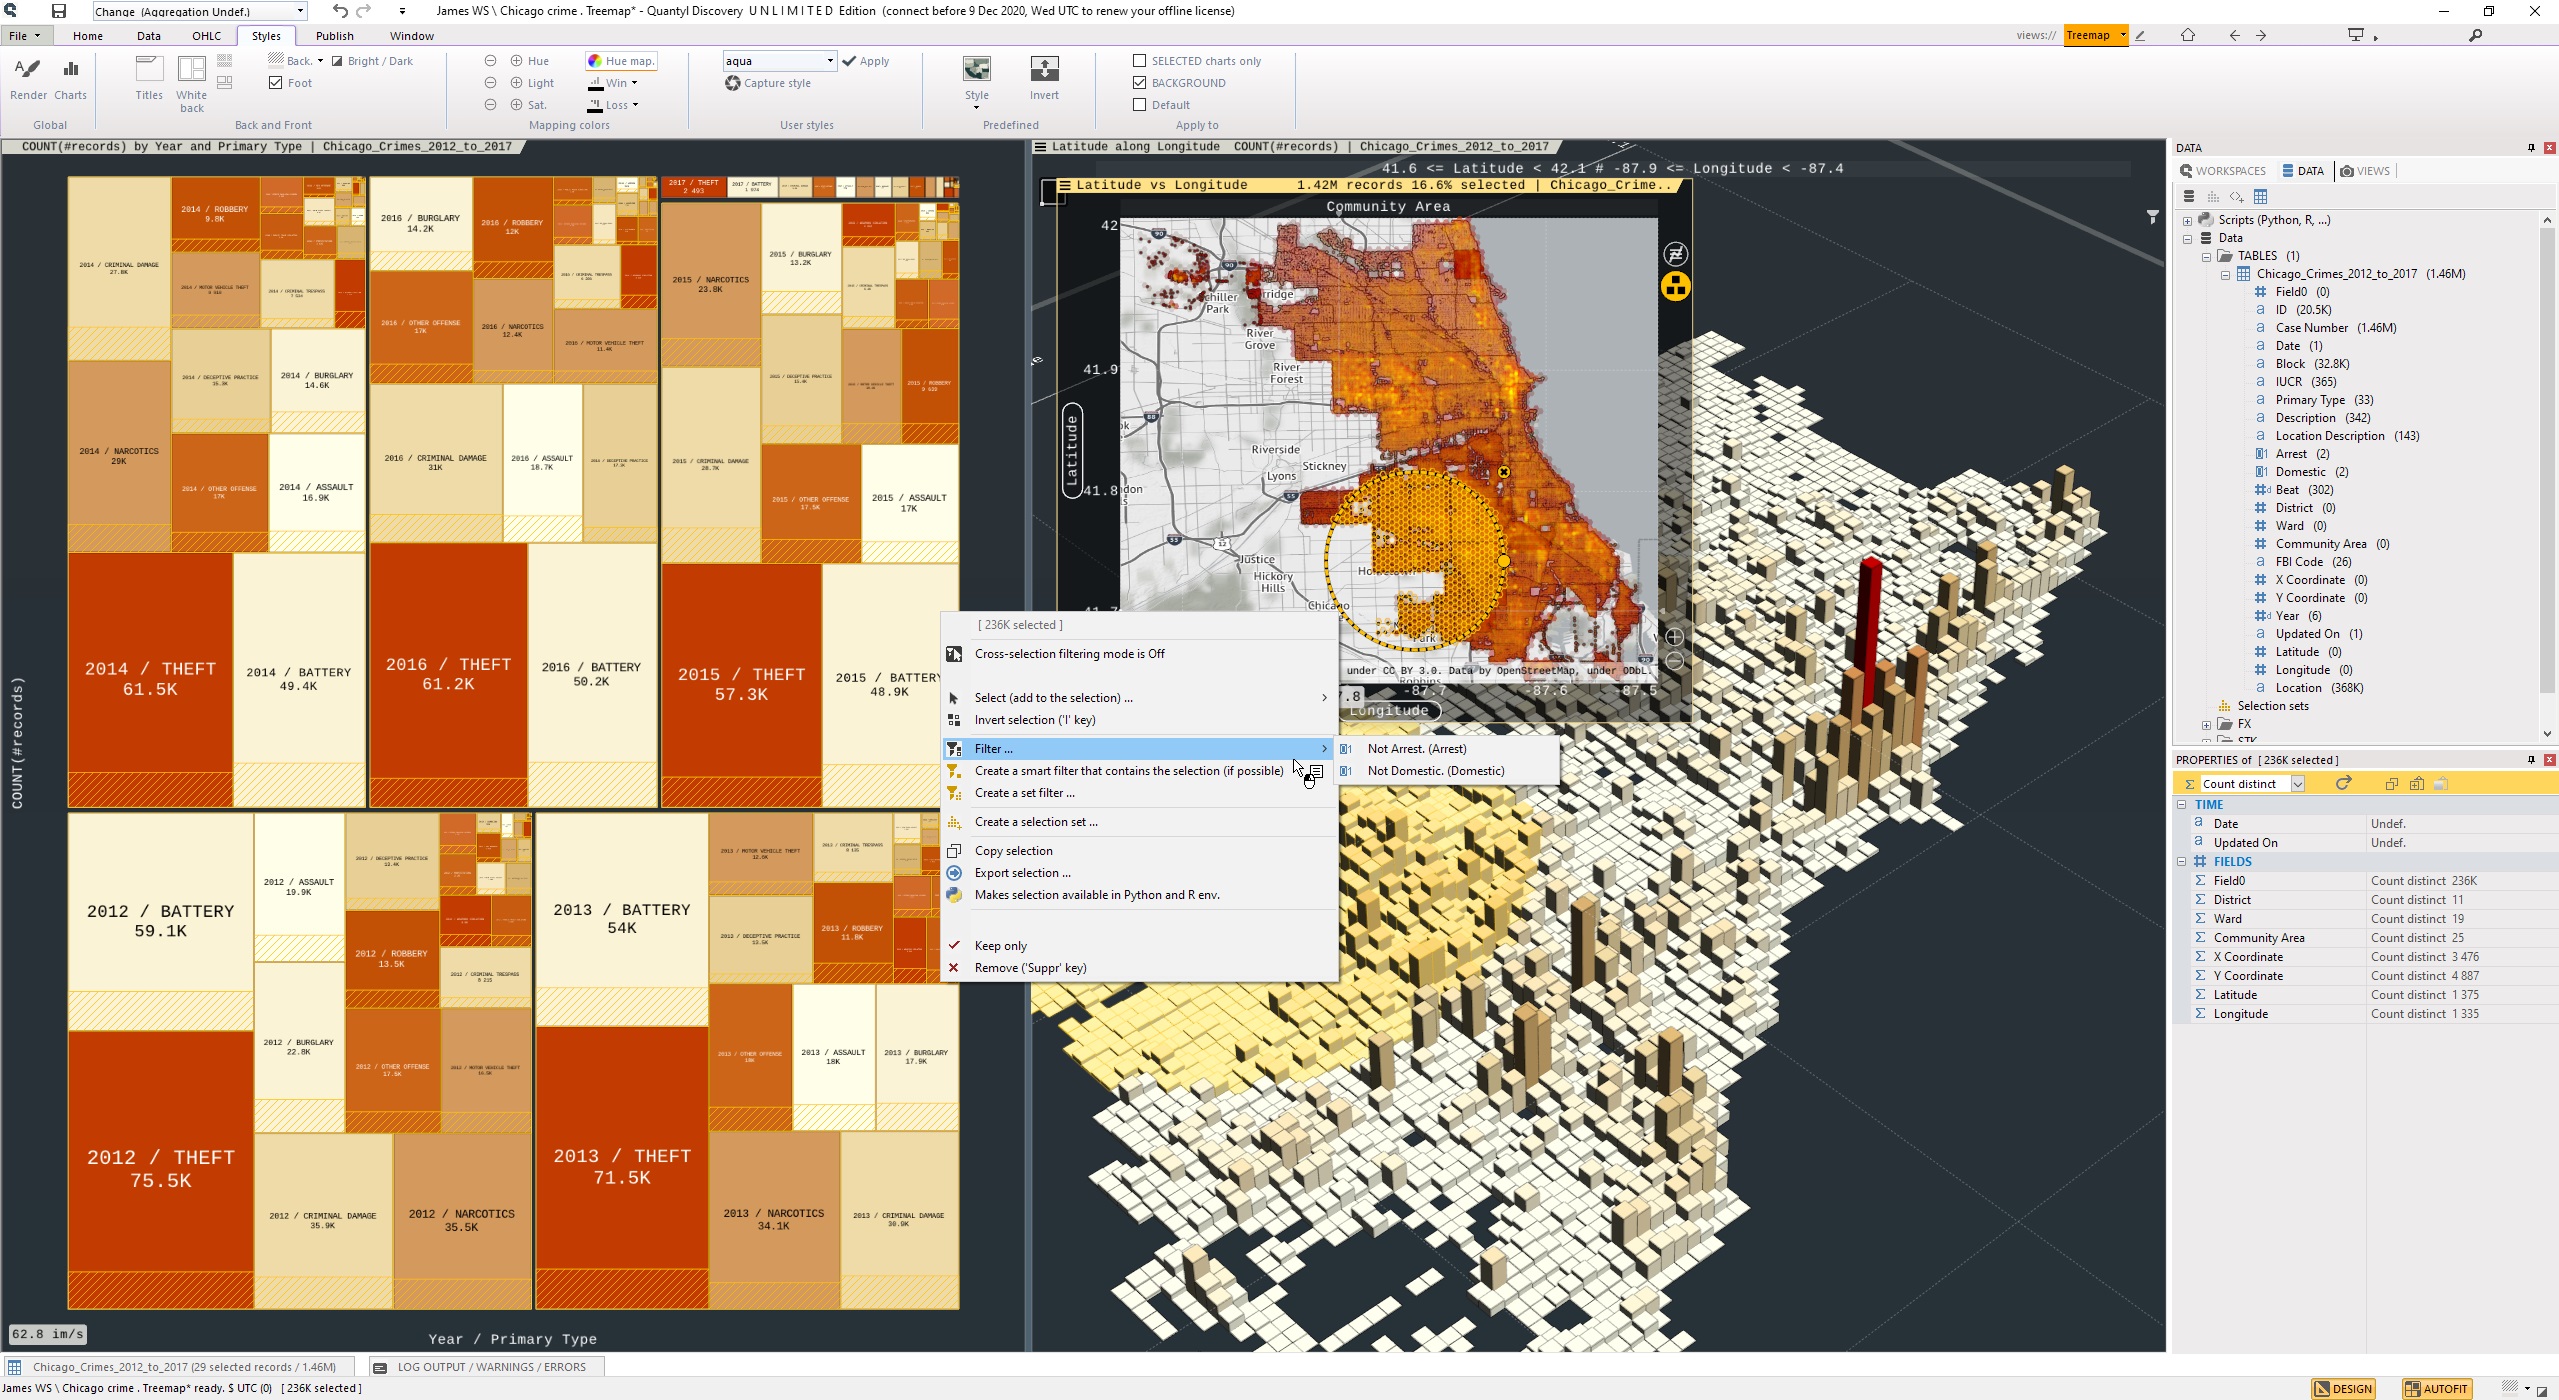
Quantyl Discovery user interface is built upon a very effective and generic selection-properties mechanism, the result of years of research and improvment. Select a single object or millions (either charts, records, tables etc.), their properties are automatically aggregated and available in the property page for information or modification. With multiple charts, selection brushing or cross-selection filtering are intuitive and instantaneous.


selection brushing

Great value without lock-in

No need of a pricey workstation or a new cloud subscription to explore millions of records.

Both perpetual and subscription licenses are offered. Viewing is totally free.

Perpetual, free access to your own content—just like your photos and videos.

0 + rows
Free and Unlimited access to your content

Explore for free.

Create a data extract with content (views) you can share
so other users can explore your project for free!
Free, limitless content exploration, no data size caps

(Quantyl is not geo-data specific, so many of its screenshots are geo-localized simply to provide better illustration)

What kinds of Data?

Data visualization is not just for data scientists anymore.

No code

for anyone

Low code

for data specialists

Use Python or R scripts to import and transform selected data.

Quantyl Python API
Python and R friendly APIs to help you complete your Data Science arsenal
Python script
R script
visual answers to your questions in a blink of an eye
trial is free: no credit card and no private information required, no ads, no bloatware
Try on my own data

Getting started in seconds

Quantl Discovery is based on a powerful selection-properties paradigm. Select data, charts, tables, fields with the same tools, properties are instantaneously aggregated in the property page.

Interactive analytics with no latency.

We're living in the multicore era - did you know that mainstream laptops and desktop PCs have made quantum leaps in performance over recent years? You're looking at it right now! What if you could benefit from all this computing power?

You, your machine, and your data. It's that simple​.